Response Surfaces & Steepest Ascent
Response surface methodology is a sequential approach to improving a process with quantitative factors. Start with a local model, take informative steps, then redesign the experiment around the promising region.
A fitted plane gives a direction of improvement, not a finite unconstrained optimum. New observations are needed as the process moves beyond the initial experimental region.
The Sequential Strategy
| Stage | Purpose |
|---|---|
| Local experiment | Estimate a first-order response model in a feasible starting region. |
| Directional runs | Move along a promising path and observe whether the response improves. |
| New local experiment | Recenter and investigate the shape near a promising region. |
| Optimization and confirmation | Fit a suitable richer model, identify a feasible candidate, and validate it with new runs. |
This approach is especially useful after screening has reduced the number of active numerical factors. Categorical choices need separate comparisons or an appropriate mixed-factor design; they do not have a continuous direction to move along.
Coding & Decoding
For natural-unit factor , center , and half-range ,
Coding expresses changes relative to meaningful experimental ranges. It also defines the scale on which “steepest” is measured.
For A ranging from 30 to 40 and B from 150 to 160,
The center is , and both half-ranges are 5.
First-Order Model & Gradient
Fit a local first-order model
Its gradient in coded units is .
For a coded step of fixed Euclidean length , Cauchy-Schwarz gives
Equality holds for
This is the steepest-ascent direction. For minimizing the response, reverse the sign for steepest descent. If is zero or very uncertain, a reliable directional recommendation may not be available.
Scaling Matters
The natural-unit step is
For the first-order model, the natural-unit derivative is . A direction steepest under coded Euclidean distance is not generally steepest under unscaled natural-unit distance. Coding defines the relative cost of movement in each factor dimension.
The direction alone does not specify step length. Choose feasible, informative increments using process knowledge and constraints. Very large steps can leave the region where the fitted plane is useful.
Worked Local Experiment
Consider these quantitative settings and observed responses:
| A | B | Response | ||
|---|---|---|---|---|
| 30 | 150 | -1 | -1 | 39.3 |
| 30 | 160 | -1 | +1 | 40.0 |
| 40 | 150 | +1 | -1 | 40.9 |
| 40 | 160 | +1 | +1 | 41.5 |
The factorial-point mean is 40.425. The coded main-effect coefficients are
This model is deliberately local. It is not evidence that the response will increase indefinitely.
Check Whether a Plane Is Useful Locally
The coded interaction coefficient from these four corners is
Suppose five independent center runs at give
Then and the center pure-error variance is on 4 df. Assuming common variance across corners and center,
| Check | on df | Approximate |
|---|---|---|
| Interaction | 0.0581 | 0.8213 |
| Corner-center curvature contrast | 0.0633 | 0.8137 |
These data provide little evidence against the local plane from these two checks. With only four pure-error df, that is not proof of no interaction or curvature. Inspect variability, run order, and practical uncertainty before deciding how far to move.
If the first-order model is refitted to all nine observations, its intercept becomes the overall mean, approximately 40.4444. In this balanced layout, the center rows have zero main-effect coordinates, so the slopes remain 0.775 and 0.325.
Turning the Gradient into Actual Runs
Choose . To maintain the gradient ratio,
| Step | A | B | ||
|---|---|---|---|---|
| 0 | 0 | 0 | 35 | 155 |
| 1 | 1 | 0.4194 | 40 | 157.0968 |
| 2 | 2 | 0.8387 | 45 | 159.1935 |
| 3 | 3 | 1.2581 | 50 | 161.2903 |
If equipment requires whole-unit B settings, an operational choice is . The resulting path has , not 0.41935. Record the actual settings and recognize that this is a nearby approximate direction.
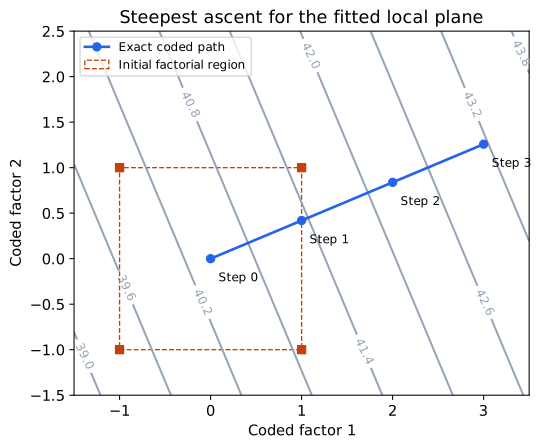
The visual shows the geometry of the fitted plane, not measured responses away from the initial design. Its straight contours do not validate long-range extrapolation.
Walk, Observe, and Recenter
At each new setting, collect a response. Continue only while the improvement remains useful and the conditions remain feasible. A decline can suggest that the best region along that path has been passed, but one low observation can also be noise or a time effect.
Consider replicate or confirmation runs when variability could change the decision.
Keep track of drift and batch changes during the sequential experiment.
If several factors are constrained, choose a feasible direction rather than following an infeasible gradient.
If curvature or important interaction is already apparent locally, a plane may be the wrong model for deciding the next direction.
For illustration, ten rounded steps of from reach . Ten exact gradient-ratio steps reach approximately . Do not mix the rounded natural settings with the exact coded path.
A promising point is not automatically the global optimum. Build a new experiment around it to learn the local response shape.
Recode Around a New Center
If a promising region is around and new low/high levels are for A and for B, define
The old and new coded variables are different coordinates. Reusing the old formula would mislabel the new runs.
Centering alone does not guarantee orthogonality; the actual allocation and replication of the new settings determine the design matrix. A balanced factorial around the new center provides the familiar orthogonal main-effect columns.
Near a stationary region, first-order slopes may become small and curvature matters more. Estimating a full quadratic model requires additional locations that separate the squared-factor columns; repeated common-center runs alone do not do that.